

Stock Market Volatility: A Deep Dive
Following a significant market correction triggered by concerns surrounding potential tariffs, the S&P 500 experienced a remarkable surge, rebounding by over 10% in a single day. This impressive recovery raises key questions: Is this the beginning of a sustained market rally, or a temporary reprieve before further declines?
The Impact of Tariffs and Recession Risks
The recent market downturn wasn't solely attributed to tariffs, but rather the potential for these tariffs to trigger an economic recession. The underlying concern is whether a pause on tariffs will truly eliminate recession risks, or if the economy is already on an irreversible path towards contraction.
The Unemployment Rate as a Recession Indicator
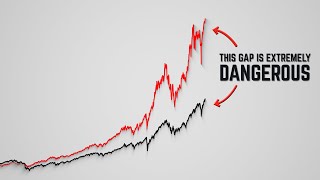
Historically, a rising unemployment rate has consistently been a defining characteristic of US recessions, dating back to the 1940s. Overlays of the S&P 500 with periods of rising unemployment clearly demonstrate a correlation with major stock market drawdowns. If a recession is indeed on the horizon, despite the tariff pause, we would expect to see the unemployment rate increase throughout 2025, signaling a weakening labor market. Stock market bottoms during recessions tend to occur after the unemployment rate peaks, suggesting potential further downside risk.
The Yield Curve: A Key Macroeconomic Indicator
The yield curve provides valuable insights into the state of the job market. Throughout history, the yield curve and the unemployment rate have generally moved in tandem.
-
In 2023, an inverted yield curve (falling below zero) suggested a potential future rise in unemployment and a recession.
-
Historically, a steepening yield curve (coming out of inversion) has signaled the onset of an economic recession and a rising unemployment rate.
However, recent observations show a reinversion of the yield curve as the S&P 500 has declined. This differs from typical recessionary patterns, such as those seen in 2001 and 2008, where the yield curve steepened during market crashes. The current reinversion suggests the yield curve is not currently anticipating a significant breakdown in the labor market.
Positive Economic Outlook?
The current situation may mirror previous instances where the unemployment rate continued to trend lower, preventing a recession and allowing the stock market to perform well. If tariffs are truly on hold and trade negotiations yield favorable results, it could create a positive macroeconomic environment for the economy and markets. Therefore, it's crucial to remain open to the possibility that this is a typical growth scare correction, rather than a prelude to a full-blown recession.
A Note of Caution: The Gold to Silver Ratio
Despite the cautiously optimistic outlook, one indicator is raising concern: the gold to silver ratio. This ratio recently experienced a significant jump of 15% within a single week.
-
A rising gold to silver ratio is often considered a risk-off signal, indicating traders are moving away from silver (seen as higher risk) and towards gold (a traditional safe haven).
-
Similar spikes in the gold to silver ratio have historically preceded significant market declines, such as the COVID crash, a 20% decline in 2011, and a 50% decline during the Great Financial Crisis.
Strategic Approach
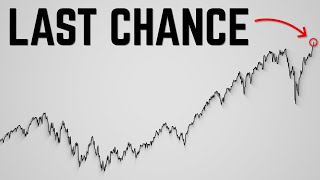
While a panic sell-off is not recommended, a rush to reallocate to stocks is also not advised. Instead, a measured approach is best, watching for solid evidence of a market bottom before increasing stock allocations.
 {#
{#  {#
{#  {#
{#  {#
{#